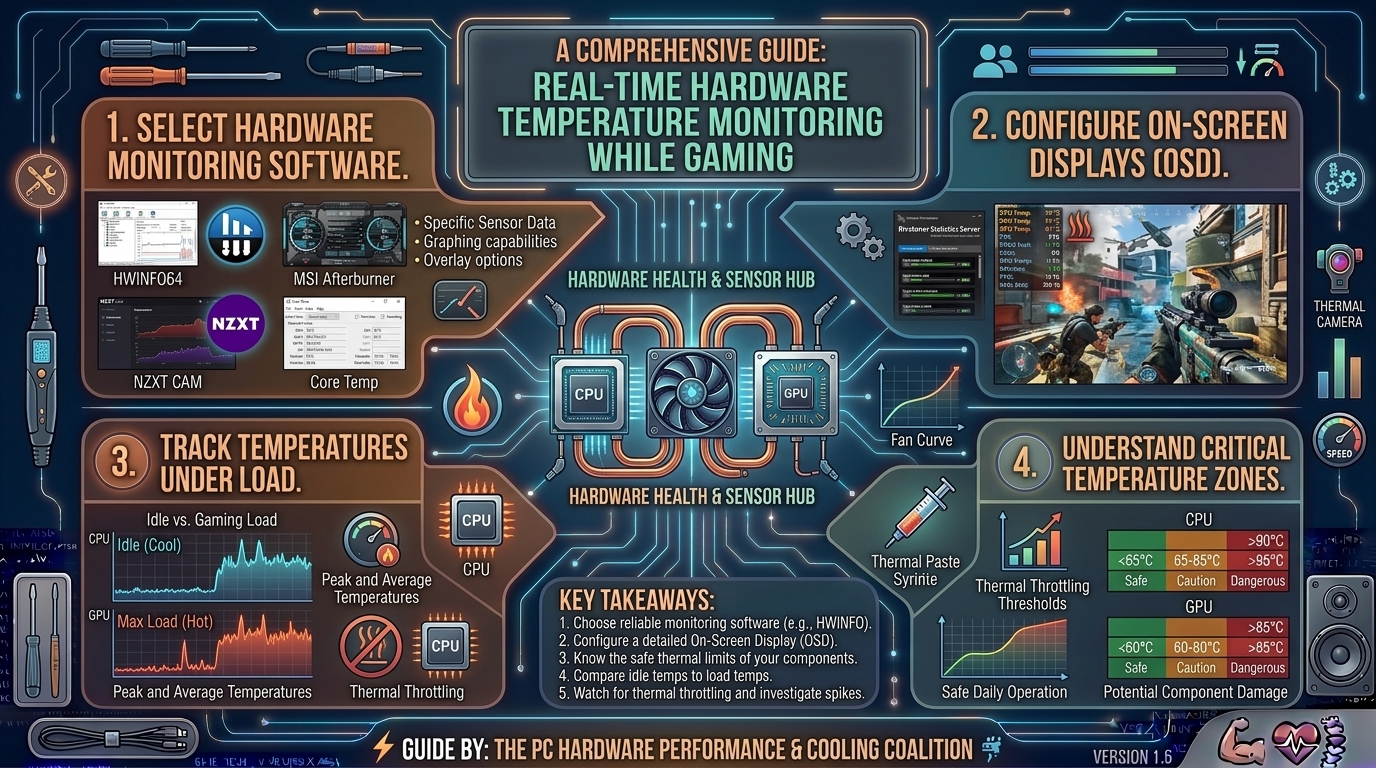
How to Check Your Computer Hardware Temperatures in Real Time While Playing Demanding Video Games
Modern PC components are engineering marvels designed to push themselves to the absolute limit. Processors (CPUs) and graphics cards (GPUs) feature advanced boost algorithms that dynamically scale clock frequencies and voltages upward until they hit a predefined thermal wall or power limit.
When you launch a graphically demanding AAA title or an intensive simulation game, your hardware draws immense power, transforming electrical current into heat. If your cooling system fails to dissipate this heat efficiently, your components will experience thermal throttling—suddenly cutting clock speeds to prevent physical damage. This results in severe frame drops, stuttering, and input lag.
Monitoring your computer hardware temperatures in real time while gaming is essential for diagnosing performance bottlenecks, verifying cooling efficiency, and protecting your expensive investments. This master guide covers the best real-time monitoring software, optimal temperature targets, how to set up in-game overlays, and how to spot warning signs before hardware failure occurs.
1. Understanding Safe vs. Dangerous Component Temperature Ranges
Before evaluating monitoring tools, it helps to understand what constitutes a normal operating temperature versus a danger zone for each core PC component.
+-------------------------------------------------------------------------+
|                 COMPONENT THERMAL THRESHOLD SUMMARY                     |
+-------------------------------------------------------------------------+
| Component       | Idle Temp   | Normal Load (Gaming) | Critical / Throttling |
+-----------------+-------------+----------------------+-----------------------+
| CPU (Intel/AMD) | 30°C - 45°C | 60°C - 80°C          | 95°C - 100°C+         |
| GPU (Core)      | 30°C - 40°C | 65°C - 78°C          | 85°C - 90°C+          |
| GPU (Hot Spot)  | 40°C - 50°C | 78°C - 90°C          | 105°C - 110°C         |
| System RAM      | 35°C - 45°C | 45°C - 55°C          | 70°C+                 |
| Storage (NVMe)  | 35°C - 45°C | 50°C - 70°C          | 80°C - 85°C+          |
+-----------------+-------------+----------------------+-----------------------+
- CPU Temperatures: While idling, a healthy CPU sits between 30°C and 45°C. Under sustained gaming loads, temperatures ranging from 60°C to 80°C are completely normal. Once a processor crosses 90°C to 95°C, it begins thermal throttling.
- GPU Core vs. Hot Spot: The main GPU core should stay below 80°C during heavy gaming. However, modern GPUs (NVIDIA RTX and AMD Radeon) also track a “Hot Spot” temperature—the single hottest microscopic point on the silicon die. Hot spot temperatures up to 15°C–20°C higher than the core average (up to 95°C–100°C) are considered safe by manufacturers.
2. Top Software Tools for Real-Time Temperature Monitoring
Choosing the right monitoring software depends on whether you want a comprehensive system diagnostic dashboard or a clean, unobtrusive in-game heads-up display (HUD).
+-------------------------------------------------------------------------+
|                   MONITORING TOOL SELECTION MATRIX                      |
+-------------------------------------------------------------------------+
| 1. HWiNFO64       ──► Deepest sensor data, logging, and accurate telemetry|
| 2. MSI Afterburner──► Best real-time on-screen display (OSD) via RTSS   |
| 3. NZXT Cam / L-Connect ──► Clean UI, brand-specific fan/temp management|
| 4. HWMonitor      ──► Lightweight, quick overview of min/max voltages   |
+-------------------------------------------------------------------------+
1. HWiNFO64 (The Gold Standard for Deep Diagnostics)
HWiNFO64 is widely regarded by hardware technicians and enthusiasts as the most accurate monitoring tool available. It interfaces directly with your motherboard’s Super I/O chip and internal component sensors.
- Key Features: Reads hundreds of individual data points including CPU core temperatures, package power draw, individual VRAM temperatures, SSD drive health, and fan RPMs.
- Best Used For: Comprehensive system diagnostics and checking historical max/min values after a gaming session.
2. MSI Afterburner with RivaTuner Statistics Server (RTSS)
If you want to view live temperatures directly on your screen while playing a game without Alt-Tab clipping, MSI Afterburner paired with RTSS is the industry standard.
- Key Features: Renders a customizable real-time text overlay in the corner of your monitor showing GPU temperature, CPU usage, frame rates, and memory consumption.
- Best Used For: In-game monitoring and GPU overclocking/undervolting.
3. Step-by-Step: Setting Up an In-Game Temperature Overlay
To track your temperatures live while playing games, configure MSI Afterburner and RTSS by following these steps:
+-------------------------------------------------------------------------+
|                    MSI AFTERBURNER OSD SETUP FLOW                       |
+-------------------------------------------------------------------------+
| 1. Open MSI Afterburner Settings ──► Navigate to "Monitoring" Tab       |
|      │                                                                  |
|      ▼                                                                  |
| 2. Select Sensors (GPU Temp, CPU Temp, Framerate, RAM Usage)             |
|      │                                                                  |
|      ▼                                                                  |
| 3. Check "Show in On-Screen Display" for each selected metric           |
|      │                                                                  |
|      ▼                                                                  |
| 4. Open RTSS ──► Customize OSD Font Size, Color, and Screen Position     |
+-------------------------------------------------------------------------+
- Install MSI Afterburner (ensure the checkbox to install RivaTuner Statistics Server (RTSS) during setup is checked).
- Open MSI Afterburner and click the Gear Icon (Settings) on the left side.
- Navigate to the Monitoring tab.
- Scroll down the Active hardware monitoring graphs list and click the checkbox next to critical metrics:
- GPU temperature
- CPU temperature (or individual core temperatures)
- Memory usage
- Framerate (FPS)
- For each selected metric, click the checkbox at the bottom labeled “Show in On-Screen Display”.
- Switch to the OSD (On-Screen Display) tab in Settings and assign a convenient toggle hotkey (e.g.,
Toggle On-Screen Display: Scroll LockorF12) to turn the overlay on and off while gaming. - Launch RTSS from your system tray to adjust text color, screen corner placement, and font size so it doesn’t obstruct your game UI.
4. Advanced Logging: How to Catch Thermal Spikes After a Crash
If your computer suddenly shuts down or restarts while gaming, you cannot look at an on-screen overlay because the power cut. To diagnose whether thermal spikes caused the crash:
- Open HWiNFO64 and select Sensors-only upon startup.
- Click the Clock with a Green Plus Icon at the bottom right (“Start Logging”) to save a CSV log file to your desktop.
- Play your game until the system crashes.
- Reboot your PC, open the CSV log file in Microsoft Excel or Notepad, and scroll to the very bottom. Look at the final entries right before the timestamp cut off to see if CPU or GPU temperatures exceeded 100°C.
5. Summary Table: Hardware Monitoring Software Comparison
| Software | In-Game Overlay (OSD) | Detailed Sensor Data | Resource Footprint | Best Use Case |
| MSI Afterburner + RTSS | Yes (Excellent) | Moderate | Low | Live in-game monitoring & FPS tracking |
| HWiNFO64 | No | Yes (Comprehensive) | Very Low | Deep diagnostics & hardware logging |
| HWMonitor | No | Good | Ultra Low | Quick check of minimum/maximum specs |
| NZXT CAM / Armoury Crate | Limited | Basic | Moderate | RGB synchronization & general user overview |
6. Frequently Asked Questions (FAQ)
1. What is a dangerous temperature for a modern graphics card while gaming?
If your GPU core temperature exceeds 85°C to 90°C, or if your VRAM/Hot Spot temperatures exceed 105°C, your card is running too hot. Modern GPUs will automatically throttle performance to cool down, and sustained extreme heat can degrade solder joints over time.
2. Why is my CPU temperature spiking to 90°C+ the second I load a game?
Instant temperature spikes usually indicate a poor physical connection between the CPU cooler and the processor. Common culprits include forgetting to peel off the plastic protective film on the bottom of the cooler, dried-out thermal paste, or a failing liquid cooling pump.
3. Does monitoring software like HWiNFO64 or MSI Afterburner reduce gaming performance?
No. These programs consume a negligible amount of system RAM (usually under 50MB) and draw minimal CPU cycles (less than 0.5% utilization), having zero impact on your game’s frame rates.
4. Why does my CPU run hotter than my GPU during gaming?
CPUs are densely packed silicon dies handling complex multi-threaded calculations, physics, and game logic, often dissipating heat inside a confined space beneath a small IHS. GPUs spread thermal output across a much larger physical die and massive fin-stack heatsink, making them easier to cool in many builds.
5. What is the difference between CPU Core Temperature and CPU Package Temperature?
- Core Temperature: Measures individual processing core units.
- Package Temperature: Measures the overall temperature across the entire CPU chip die, including the integrated memory controller and cache. Package temperature is usually the highest reading and the best metric for tracking thermal throttling.
6. Can cleaning dust out of my PC really lower temperatures significantly?
Yes, dramatically. Dust acts as an insulating blanket over radiator fins and heatsinks, trapping heat. Cleaning out dust filters and blowing compressed air through your CPU cooler and GPU shroud every 3 to 6 months can drop temperatures by 5°C to 15°C.
7. Why are my component temperatures higher in the summer than in the winter?
PC cooling relies on thermal transfer with ambient room air. If your room temperature rises from 20°C (68°F) to 30°C (86°F) during summer, your internal PC component temperatures will rise by that exact same margin because the intake air is warmer.
8. How do I know if my PC is actively thermal throttling?
You can use monitoring tools like HWiNFO64. Scroll down to your CPU and GPU metrics and check the fields labeled “Thermal Throttling” or “Performance Limit – Thermal”. If they report “Yes” or show a green-to-red status change during gaming, your system is throttling.
9. Should I trust software temperature readings or buy an external laser thermometer?
Software temperature readings are pulled directly from internal digital thermal diodes embedded inside the silicon die, making them highly accurate. External infrared laser thermometers only measure the outside surface of a heatsink or backplate, which is always significantly cooler than internal core temperatures.
10. Does undervolting my GPU or CPU reduce gaming temperatures?
Yes. Undervolting reduces the electrical voltage delivered to the silicon without lowering clock speeds. Because heat output scales exponentially with voltage, a minor undervolt can drop temperatures by 5°C to 10°C while maintaining or even improving frame rates.
Checking your computer hardware temperatures in real time empowers you to catch cooling failures, eliminate thermal throttling, and ensure your system runs smoothly. Whether you use HWiNFO64 for deep logging or MSI Afterburner to run a live in-game overlay, keeping an eye on your thermals guarantees peak performance during long gaming sessions.
Leave a Reply