Welcome to thegamerbuzz.com! Whether you are tracking market movements from a tech hub like San Francisco, an economic powerhouse like New York, or evaluating consumer trends across Washington, Texas, and California, understanding the business engine behind interactive entertainment is essential.
The video game industry is a multi-billion-dollar global juggernaut that routinely outpaces the box office and music industries combined. However, looking past the hype of flashy cinematic trailers reveals a complex web of balance sheets, monetization models, digital storefront metrics, and hardware cycles.
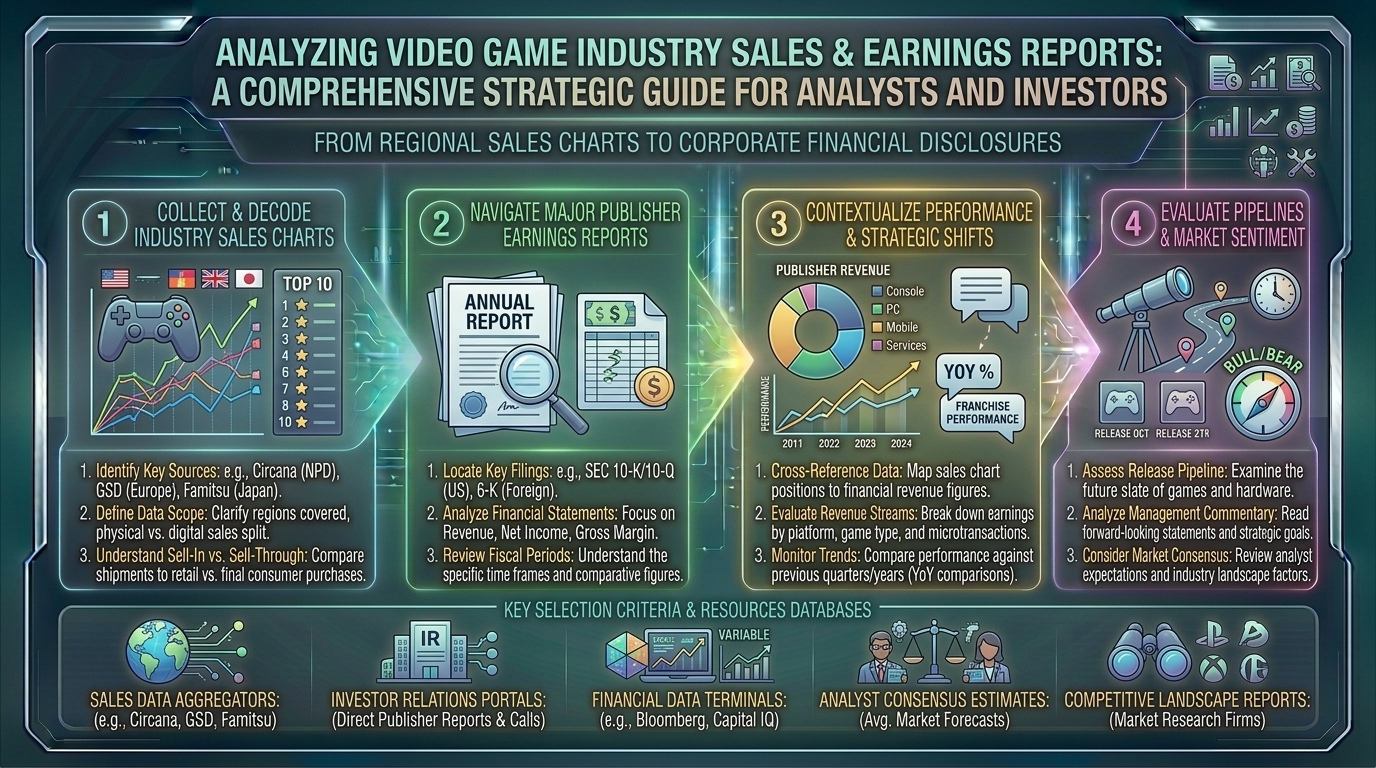
This master guide provides a comprehensive breakdown of how to read, interpret, and extract actionable insights from video game industry sales charts and financial earnings reports released by major publishers like Electronic Arts, Take-Two Interactive, Ubisoft, Nintendo, Sony, and Microsoft.
1. Deconstructing Video Game Industry Sales Charts
Sales charts serve as the heartbeat of market activity. They provide short-term momentum data and long-term validation of consumer behavior across regions like North America, Europe, and Asia.
Types of Sales Charts
- Physical Retail Trackers: Historically managed by entities like Circana (formerly NPD Group) in the United States or GfK in Europe, these track physical disc and cartridge sales at brick-and-mortar retail chains.
- Digital Ecosystem Dashboards: Because publishers rarely share exact daily digital sales figures, analysts look to platform-specific charts (e.g., Steam’s Top Sellers by revenue, PlayStation Store’s monthly most-downloaded charts, and Nintendo eShop rankings).
- Global Aggregators: Platforms like SteamDB or independent industry trackers estimate concurrent user peaks, wishlist metrics, and sales milestones to build reliable estimates.
Key Metrics to Watch
- Unit Sales vs. Gross Revenue: Always distinguish between how many copies of a game were sold versus how much actual money it generated. A $70 AAA blockbuster moves differently on a balance sheet compared to a free-to-play title fueled by microtransactions.
- The “Long Tail” Phenomenon: Analyze whether a game drops off the charts after two weeks or maintains a steady position due to word-of-mouth, discounts, or seasonal updates.
2. Navigating Major Publisher Financial Earnings Reports
Publicly traded gaming giants are legally required to release quarterly (10-Q) and annual (10-K) financial reports. These documents peel back the marketing curtain to reveal true financial health.
+-------------------------------------------------------------------------+
                    CORE FINANCIAL REPORT STRUCTURE
+-------------------------------------------------------------------------+
  1. Executive Summary & CEO Commentary  -> High-level strategic vision
  2. Income Statement (P&L)              -> Revenue, expenses, net income
  3. Segment Reporting                   -> Breakdown by platform/geo
  4. Forward-Looking Guidance            -> Future fiscal expectations
+-------------------------------------------------------------------------+
Key Sections of an Earnings Report
- Net Bookings vs. GAAP Revenue: Due to deferred revenue accounting rules for live-service games (where content is delivered over time), publishers use Net Bookings (the net amount of products and services sold digitally or physically in a period) as a truer measure of immediate sales performance.
- Operating Expenses (OpEx): Look closely at Research & Development (R&D) and Sales & Marketing (S&M) expenses. Ballooning R&D often signals troubled or elongated development cycles (e.g., game delays or reboots).
- Catalog Revenue vs. New Releases: Healthy publishers rely on a mix of both. A high percentage of catalog (older game) revenue indicates a strong, evergreen IP portfolio (like Grand Theft Auto or FIFA/EA Sports FC).
3. Top Pro Tips for Advanced Industry Analysis
- Correlate Hardware with Software Spikes: Use regional hardware installation bases (consoles in homes) to contextualize software attach rates.
- Monitor Microtransactions and Live-Service Metrics: For modern publishers, initial box-office sales are only half the battle. Track metrics like In-Game-Advertising (IGA) and Microtransactions/DLC contributions as percentages of total digital revenue.
- Account for Seasonality: The gaming industry is heavily front-loaded toward the holiday quarter (Q3/Q4 calendar year, overlapping with publishers’ Q3 fiscal periods). Always compare current quarter performance year-over-year (YoY) rather than quarter-over-quarter (QoQ).
- Watch Currency Fluctuations (FX Risk): Major publishers operate globally. A strong US Dollar can eat into international earnings when foreign revenues are repatriated.
10 Frequently Asked Questions (FAQs)
1. What is the difference between a sales chart and a financial report?
A sales chart shows consumer popularity and unit volume over short periods, whereas a financial report details a company’s comprehensive revenue, operational costs, profitability, and future business outlook.
2. Why do digital sales figures often remain secret?
Publishers guard digital metrics to protect competitive advantages against rivals, prevent short-term stock volatility if a specific platform underperforms, and maintain leverage in licensing negotiations.
3. What does “attach rate” mean in video game analysis?
Attach rate measures the average number of auxiliary products (games, DLC, or accessories) bought per hardware unit. A high attach rate means console owners are heavily investing in software.
4. How do free-to-play (F2P) games show up in earnings reports?
F2P games generate revenue entirely through microtransactions, battle passes, and cosmetic purchases, which publishers report under “digital live-services” or recurring consumer spending (RCS).
5. Why are publisher stock prices sometimes falling even after record sales?
Wall Street operates on forward-looking expectations. If a publisher beats current sales targets but issues weak forward guidance for the next quarter, investors will sell off stock.
6. Where can I find official financial reports for gaming companies?
Publicly traded companies host these documents in the “Investor Relations” section of their corporate websites (e.g., Electronic Arts IR, Take-Two Interactive IR) or through the SEC EDGAR database.
7. What is GAAP revenue versus Non-GAAP Net Bookings?
GAAP revenue delays recognition for live-service games over the estimated play period. Non-GAAP Net Bookings recognize the actual cash value of sales made immediately during that specific quarter.
8. How do delays of major games impact publisher financials?
A AAA game delay shifts anticipated revenue into a future fiscal year, often causing a temporary dip in short-term stock value and forcing publishers to lean heavily on existing catalog titles.
9. Are physical retail charts still relevant today?
Yes. While digital sales make up 80%+ of the market in regions like North America, physical charts provide a reliable baseline benchmark for console-specific blockbusters, particularly on Nintendo hardware.
10. How can indie or mobile game data be tracked if publishers are private?
Analysts rely on third-party mobile intelligence platforms (like Sensor Tower or Data.ai) and estimates from Steam database trackers to evaluate private market performance.
Conclusion
Analyzing the video game industry requires a balanced blend of quantitative data science and qualitative market awareness. By cross-referencing retail and digital sales charts with the rigorous data housed within publisher financial reports, analysts, developers, and investors can accurately forecast where the market is heading. Whether you are scaling an enterprise in New York or researching gaming tech trends out in San Francisco and Seattle, mastering these reports transforms raw numbers into a clear roadmap of the future of interactive entertainment.
Video Game Sales Analysis Tutorial
This video provides a practical visual demonstration of how raw gaming sales data sets are structured and analyzed using spreadsheets and dashboards.
Leave a Reply